The customer problem
The customer problem
Integration failures often pass through several systems before anyone notices the business impact. Support may know the customer issue while engineering has only partial logs.
Apyrn Trace early access
When information moves between systems, Apyrn Trace shows the journey step by step. Teams can see where it stopped, what was retried, which outside service responded with an error, and which customers or records may need attention.
Example: a customer record does not reach the customer-management system. Trace shows the run, highlights the failed step, and connects it to the affected record.
Guided explanation
The customer problem
Integration failures often pass through several systems before anyone notices the business impact. Support may know the customer issue while engineering has only partial logs.
The better operating model
Trace creates a step-by-step record of an integration run so teams can see where work stopped, what was retried, which outside service responded with an error, and what may be affected.
The solution approach
Send integration run, step, retry, event, and outside-service details to Trace, then use one timeline to investigate failures and repeated patterns.
Conceptual architecture
Accepts typed SDK ingestion, REST ingestion, and OTLP JSON-compatible trace ingestion.
Shows run search, timeline detail, retry history, failure groups, provider health, alerts, saved filters, and impact views.
Supports API-key lifecycle, tenant-scoped controls, retention cleanup, audited deletion requests, and Slack alert delivery.
Enterprise examples
A customer record fails to reach a customer-management system and needs one shared explanation.
A shipping provider starts rejecting requests and many delayed orders need review.
Support and engineering need the same incident view without copying raw log lines between tools.
What this enables
Help teams understand one failed business process from start to finish.
Group repeated failures so teams do not treat every incident as new.
Connect technical failure details to affected customers, accounts, records, or orders.
Scope and qualification
Early access; position Trace as integration observability, not a general-purpose application monitoring replacement.
The implemented ingestion path includes OTLP JSON-compatible trace ingestion, not full OpenTelemetry protocol coverage.
Recognize the problem
An integration run is one complete attempt to move information or complete work across connected systems. Trace creates a step-by-step record of that run.
Support knows the affected customer, but engineering has to search across several systems to learn where the work stopped.
Teams handle every failed sync as a new incident because repeated provider or mapping problems are not grouped together.
Operators need to know which customers, accounts, records, or orders may need attention after a technical failure.
How it helps
Trace receives run, step, retry, event, and outside-service details as the integration does its work.
Trace shows the failed step, retry history, provider response, and similar failure group in one operational view.
Trace surfaces the affected customer, account, record, object, or order information the integration recorded.
Illustrative use cases
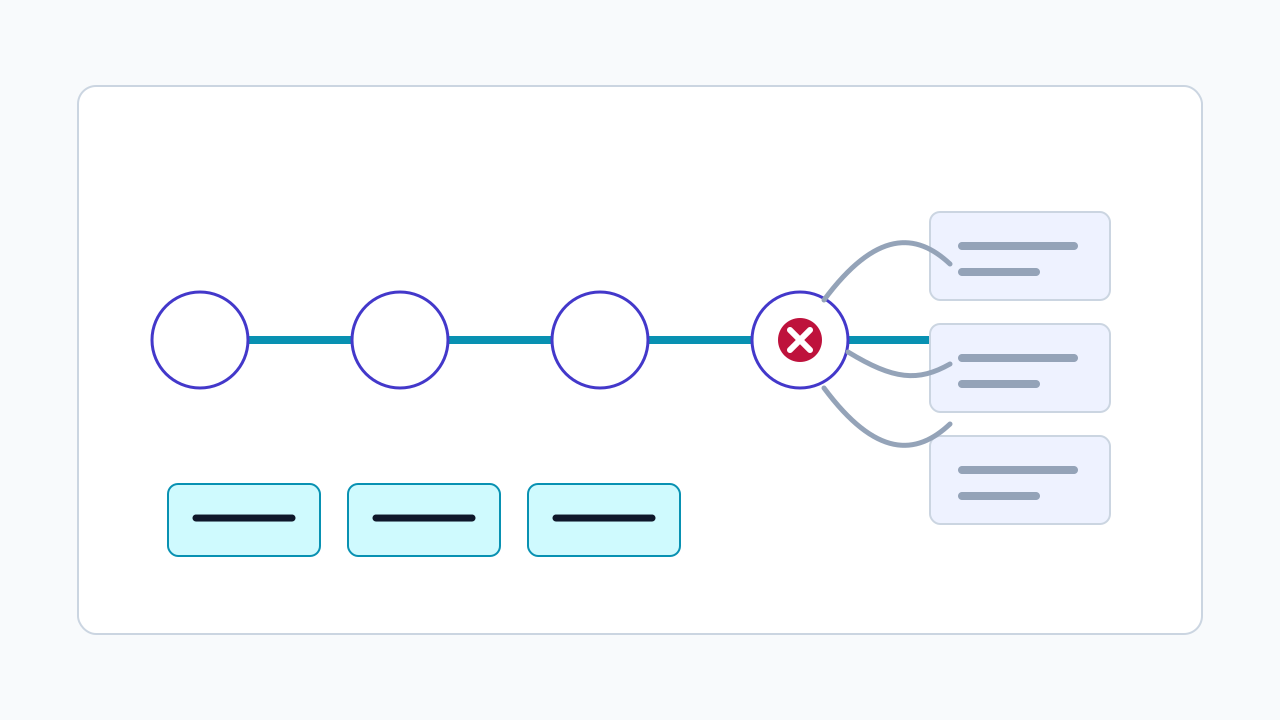
A customer-success manager investigates missing account information. Trace shows the complete run, highlights the failed CRM step, and identifies the customer record linked to that run.
Page visual: source system, mapping, CRM update, failed step, and affected record.An operations lead sees delayed shipment updates and needs to know whether the issue is internal or provider-side. Trace groups similar failures, shows the provider response and retries, and surfaces affected orders.
Page visual: several failures grouped into one understandable provider issue.A support engineer escalates a customer ticket with customer context while engineering has technical logs. Trace gives both teams the same timeline, retry history, failure group, and impact context.
Page visual: one shared timeline with business labels and optional technical detail.What teams can do
Review run lists, run details, timeline exports, step history, outside API calls, retries, and events.
See similar failures together so teams can focus on a recurring provider, mapping, or integration issue.
Connect failures to customers, accounts, records, objects, or orders recorded by the integration.
Use saved filters, alert rules, alert events, Slack delivery, metrics, usage views, and audit logs.
What Trace does not replace
Trace focuses on B2B integration runs, retries, provider errors, failure groups, and business impact. It is early access, and the implemented OpenTelemetry-related path is OTLP JSON-compatible trace ingestion rather than full protocol coverage.
For technical teams
Trace supports typed TypeScript SDK ingestion, REST ingestion for runs and related events, and OTLP JSON-compatible trace ingestion.
Trace models runs, steps, spans, external API calls, retries, events, failure groups, provider health, saved filters, and impact views.
Trace supports API-key lifecycle with one-time reveal and hashed storage, tenant-scoped roles, retention cleanup, audited deletion requests, Slack alert delivery, metrics, usage, and audit views.
FAQ
An integration run is one complete attempt to move information or complete work across connected systems.
Trace can show recorded steps, spans, outside API calls, retries, events, failure details, and related business impact.
The integration records affected customer, account, record, object, or order details as part of the run context.
Trace has implemented alert rules, alert events, and Slack delivery. Email delivery should not be claimed on this page.
Join early access to review whether Trace fits a failed sync, provider error, retry, customer-impact, or support-escalation workflow.